Functions where "nearby" Input does not generate "nearby" Output.
Two things we might want to do with a function:
We use a function with a known equation as an example to illustrate what the unknown function might look like.
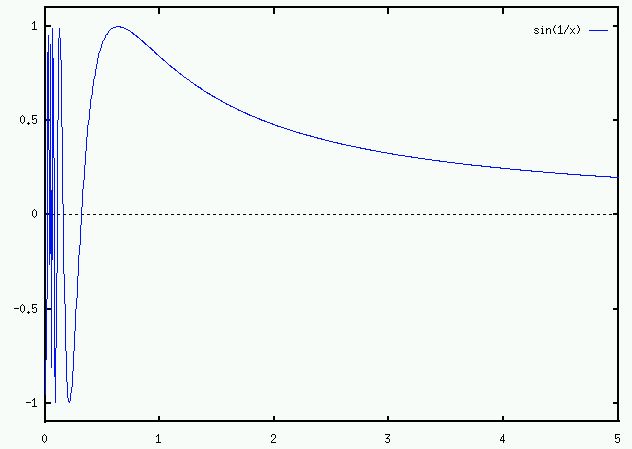
If you are told the equation for this function is sin(1/x):
If you do not have its equation, but are learning it through exemplars:
First consider sin(x):
sin ( 0 ) = 0( period = 2 π )
sin ( 0.5 π ) = 1 (radians)
sin ( π ) = 0
sin ( 1.5 π ) = -1
sin ( 2 π ) = 0
sin ( 2.5 π ) = 1
sin ( 3 π ) = 0
sin ( 3.5 π ) = -1
...
sin ( 10001.5 π ) = -1
sin ( 10002.5 π ) = 1
sin ( 10003.5 π ) = -1
sin ( 10004.5 π ) = 1
...
Hence:
f ( 1 / ( 10001.5 π )) = -1For arbitrarily high integers n:
f ( 1 / ( 10002.5 π )) = 1
f ( 1 / ( 10003.5 π )) = -1
f ( 1 / ( 10004.5 π )) = 1
...
f ( 1 / ( 100000000001.5 π )) = -1
f ( 1 / ( 100000000002.5 π )) = 1
f ( 1 / ( 100000000003.5 π )) = -1
f ( 1 / ( 100000000004.5 π )) = 1
...
f ( 1 / ( 100000000000000000000001.5 π )) = -1
f ( 1 / ( 100000000000000000000002.5 π )) = 1
f ( 1 / ( 100000000000000000000003.5 π )) = -1
f ( 1 / ( 100000000000000000000004.5 π )) = 1
...
f ( 1 / ( (2n) π )) = 0As x approaches 0, f(x) bounces back and forth between 1 and -1 more and more rapidly, such that a smaller and smaller change on the x-axis can lead to the maximum change on the y-axis.
f ( 1 / ( (2n+0.5) π )) = 1
f ( 1 / ( (2n+1) π )) = 0
f ( 1 / ( (2n+1.5) π )) = -1
Whereas far away from 0 nearby x clearly produce nearby y.
A more hi-resolution plot
(see "set samples" in gnuplot):
An even more hi-resolution plot ("set samples 10000"):
Close-up near zero:
Close-up again:
Close-up again:
We do not see an equation for the function. We do not see a graph like above. All we see are exemplars of x and f(x). The machine discovers that f has this shape through learning.
It is told (or discovers) that f(4.3) = 0.2305,
and f(4.1) = 0.2415.
So it guesses that f(4.2) = 0.2360.
Almost spot on - it's actually 0.2358.
But then it finds out that f(0.3) = - 0.19,
and f(0.1) = - 0.54.
So it guesses that f(0.2) = - 0.365.
However, this is totally wrong.
In fact, f(0.2) = - 0.95.
And what is f(0.15)?
The machine might now guess f(0.15) = - 0.745.
But it is wrong again.
In fact, f(0.15) is not even negative. It is 0.37.
Conclusion: In approximating f, we might dedicate 90 percent of our resources (the memory structure that defines f) to approximating f for x < 1. And for x > 1, we can effectively approximate f by a straight line.
But if so, this variable-resolution approximation is something we will have learnt. We did not know a priori that f was more complex in the area < 1.
In summary:
Where a tiny error or uncertainty in input measurements can cause a massive error in output (here the largest possible error), this is a chaotic function.
If we use a finite size data structure to approximate the curve, then no matter what data structure we use, there will exist a constant c > 0 such that, for all x < c our prediction is absolutely random/useless. We can predict nothing more detailed than that the y-value is in the range -1 to 1 (which we knew anyway, i.e. no predictive value at all).
For a chaotic function you can play with online, see:
This shows how, unless you have perfect knowledge of current conditions, your predictive value for conditions in the future is not just poor, but zero.
sin ( (1/(x/100)) (1/(1-x)) )
Maximise this function:
Find x that gives maximum point on y axis.
Maximise this function:
Find x that gives maximum point on y axis.
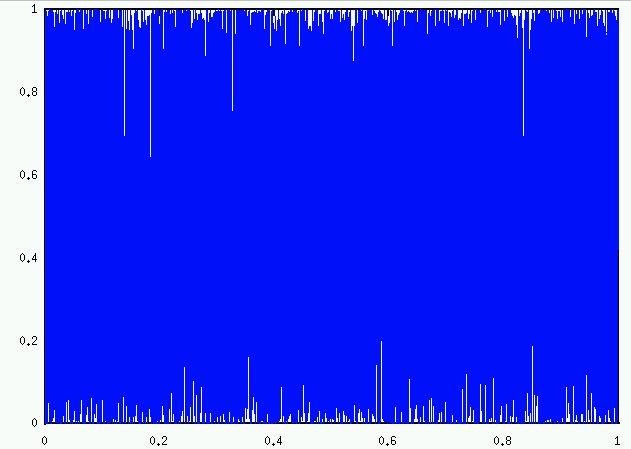
gnuplot can't really draw it. To draw it is to more or less just fill the square (x=0 to x=1, y=0 to y=1) with points.
Fractals - The same pattern repeats at different scales. Repeatedly magnify it and it looks the same. Here we could possibly represent it to reasonable accuracy (not perfect) using a finite data structure, because the range decreases. A small change does not bounce across the global range, as in the chaotic functions above.
e.g. Mandelbrot set: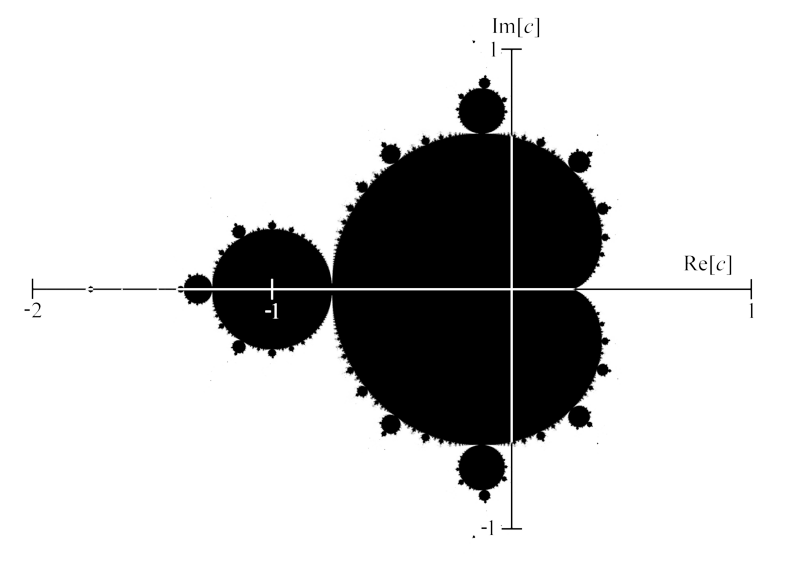