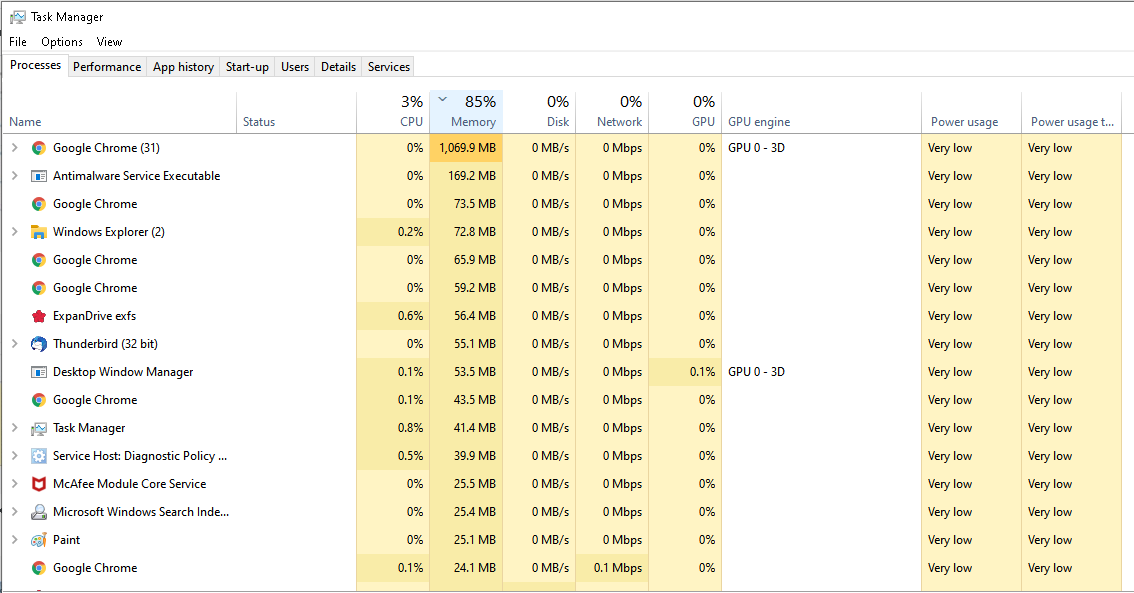
Some scenarios:
ps -u $USER -f | grep bash
ps -Af | grep nano


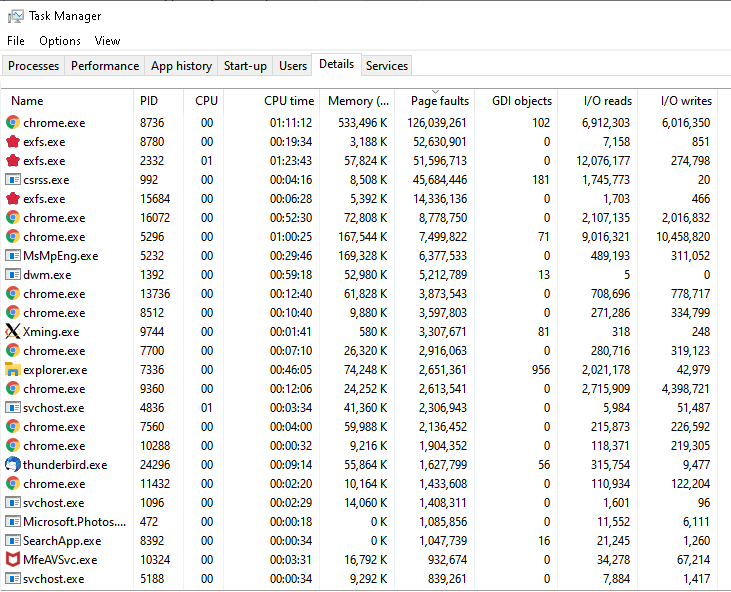
In the "Details" tab of Task Manager you can look at a range of features of each process.
Right click the top bar and "Select columns" to select the columns to show.
You can sort on any column.
Here sorted on Page faults.
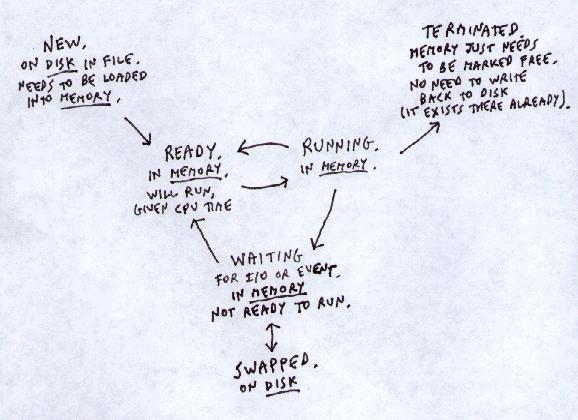
Starts running.
May pause when doing disk I/O, waiting on user event, etc.
Does not always have work for CPU to do.
May pause for long time.

READY to RUNNING -
Short-term (CPU) scheduler
decides if you can run now.
RUNNING to WAITING - I/O or event wait.
WAITING to READY - I/O or event completion.
Short period of calculation (short "CPU burst")
Long period of I/O
Short period of calculation
Long period of I/O
..
i.e. Most processes regularly "vote themselves" off the Running list anyway. - We don't have to force them to go.
Threads
2 (or more) flows of control in the same process.
2 (or more) instruction counters.
Same memory (same data and code space).
e.g. Web server - Each request is a separate thread,
all running in parallel until request completed.
e.g.
Web browser - multiple windows downloading at same time.
Each is a separate thread in same process.
see all processes and threads:
 ps -ALf

LWP = thread id
note multiple threads within same process id PID
NLWP = no. of threads in this process

sort by processes with the most threads:
 ps -ALf | sort -k6 -n

show threads for one process:
 ps -Lf -p (PID)
Modern OS will schedule threads and processes across multiple cores.
Processor affinity - The idea that once a process or thread starts running on one core, it is often more efficient to leave it there (and its data in the core's cache memory) rather than change cores.
Display number of cores available:
=====================================
$ nproc
4


Show info about the multiple cores:
=====================================
$ cat /proc/cpuinfo


Run process using core n (where n is 0 to 3 here):
===================================================
$ taskset -c n prog


See what processes are currently using what cores:
====================================================
$ ps -Ao user,pid,ppid,comm,psr

USER       PID  PPID COMMAND         PSR
root         1     0 init              0
root         2     0 kthreadd          2
root         3     2 ksoftirqd/0       0
root        25     2 watchdog/3        3
root       328     1 udevd             3
humphrys 29858 29855 sshd              0
humphrys 29859 29858 csh               0
humphrys 32373 29859 ps                1
humphrys 32374 29859 grep              1

# PSR will be 0 to 3 here


Query if process is bound to a core:
=======================================

$ taskset -p 3
pid 3's current affinity mask: 1

$ taskset -p 25
pid 25's current affinity mask: 8

# 0001 (1) - bound to core 0 (see process 3 command /0)
# 0010 (2) - bound to core 1
# 0100 (4) - bound to core 2
# 1000 (8) - bound to core 3 (see process 25 command /3)


$ taskset -p 1
pid 1's current affinity mask: f

# 1111 (f) - can run on all 4 cores, not tied to any core


See load on different cores:
==============================
$ top
(and then press 1)
/var/log
tail -20 fail2ban.log
/var/log/lastlog
lastlog -t 2
lastlog -t 2 | sort -k4